Our Featured Projects
Explore our portfolio of successful GIS and Remote Sensing projects that have made a real impact across various industries and regions worldwide.
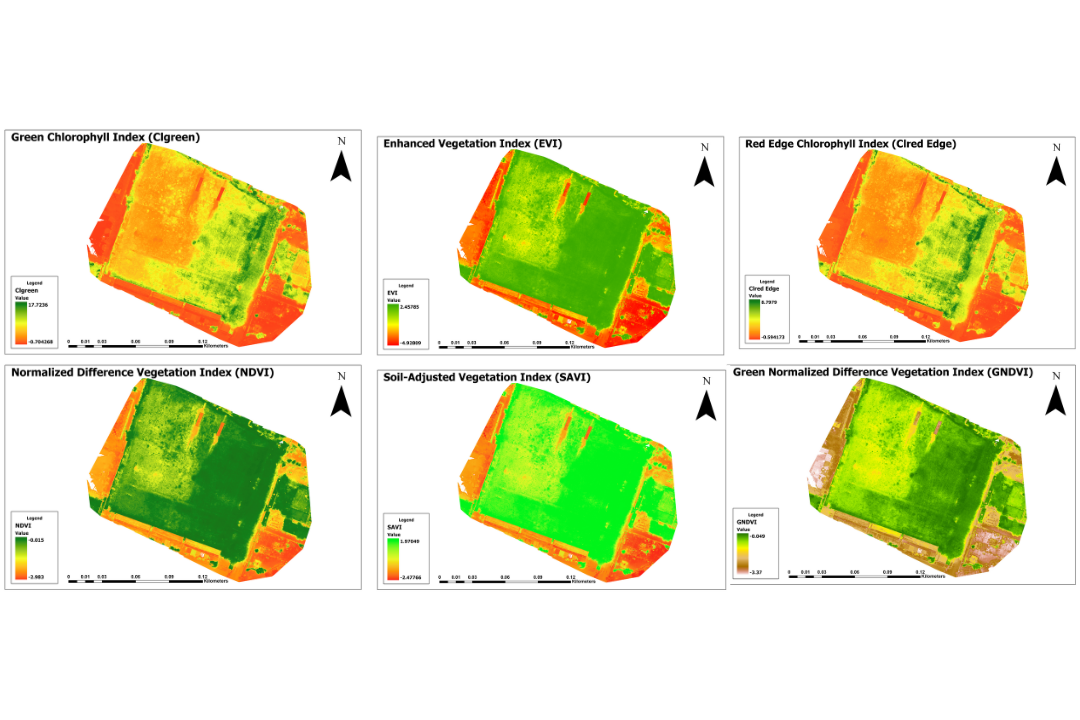
Comparative Vegetation Indices Analysis from Drone Imagery of Local Grounds
This project involved a comparative analysis of key vegetation indices derived from drone-based multispectral imagery over local grounds. The objective was to evaluate vegetation health, chlorophyll content, and canopy structure using high-resolution spectral data. The analyzed indices included NDVI (Normalized Difference Vegetation Index) for overall vegetation vigor, GNDVI (Green NDVI) for chlorophyll concentration, EVI (Enhanced Vegetation Index) for performance in dense canopies, SAVI (Soil Adjusted Vegetation Index) to minimize soil influence, NDRE (Normalized Difference Red Edge Index) for early stress detection, Clgreen (Chlorophyll Index–Green) and ClredEdge (Chlorophyll Index–Red Edge) for accurate chlorophyll estimation, and VARI (Visible Atmospherically Resistant Index) for vegetation analysis using visible bands. Each index was computed, mapped, and evaluated to determine its effectiveness under varying land conditions. The findings support the use of drone imagery and vegetation indices for precision agriculture, environmental monitoring, and land management applications.
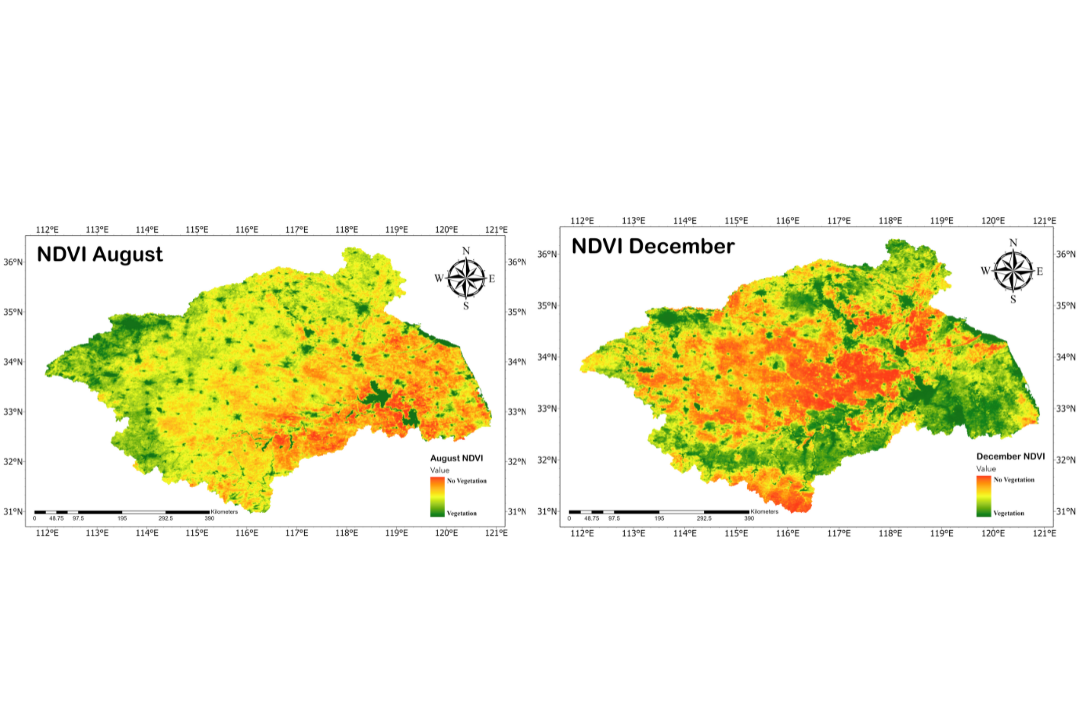
Drought Mapping (2015-2018)
In this project, We assessed drought conditions in the Huaihe River Basin, China (2015), by calculating NDVI using MODIS data. NDVI from MOD13Q1 (MODIS/Terra Vegetation Indices 16-Day L3 Global 250m) was analyzed for March, August, and December, while 40 cm soil moisture was interpolated from 37 observation points to generate detailed maps. The resulting drought and vegetation maps provide comprehensive seasonal insights into basin dynamics.
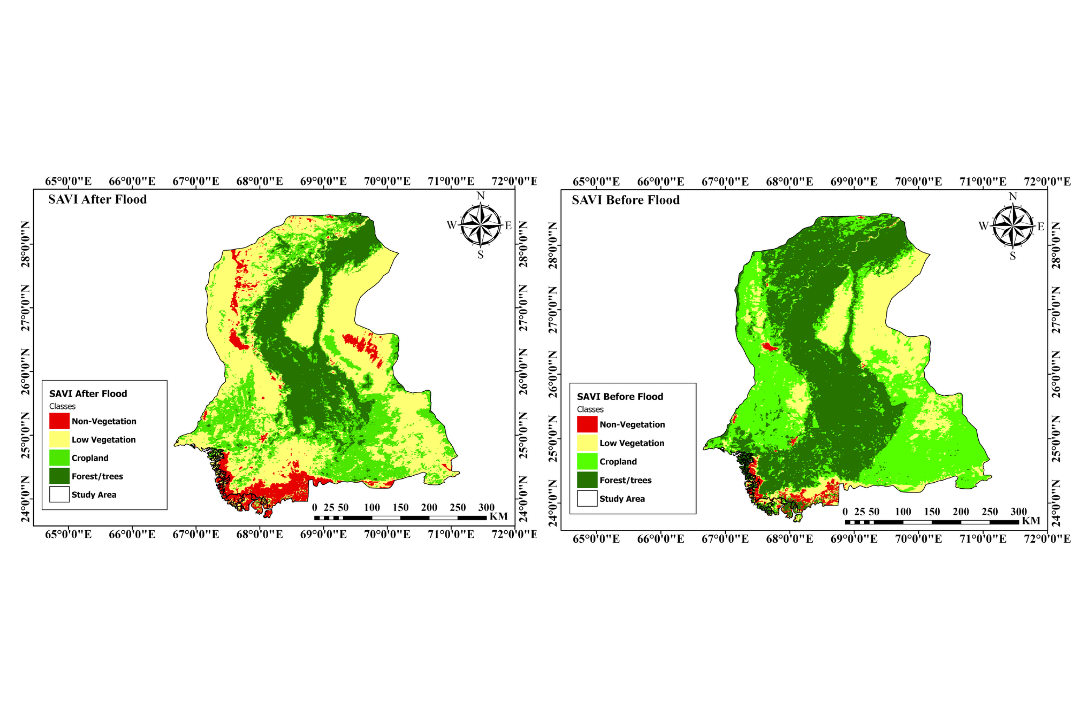
2022 Sindh Flood Analysis
In this project, We assessed the 2022 flood's impact on agricultural land in Sindh, Pakistan. Project integrate datasets including the Dynamic World V1 Land Use/Land Cover dataset (WRI, August 2022), DEM data from HydroSHEDS (2000), Global Surface Water data (1984–2022), CHIRPS precipitation data (2022), and Sentinel-1 SAR GRD data (ESA) to map flood extent and evaluate its effects on productivity and food security. Below are the Cropland before and after flood rasters, Rough Flood Extent, and Sindh's surface water.
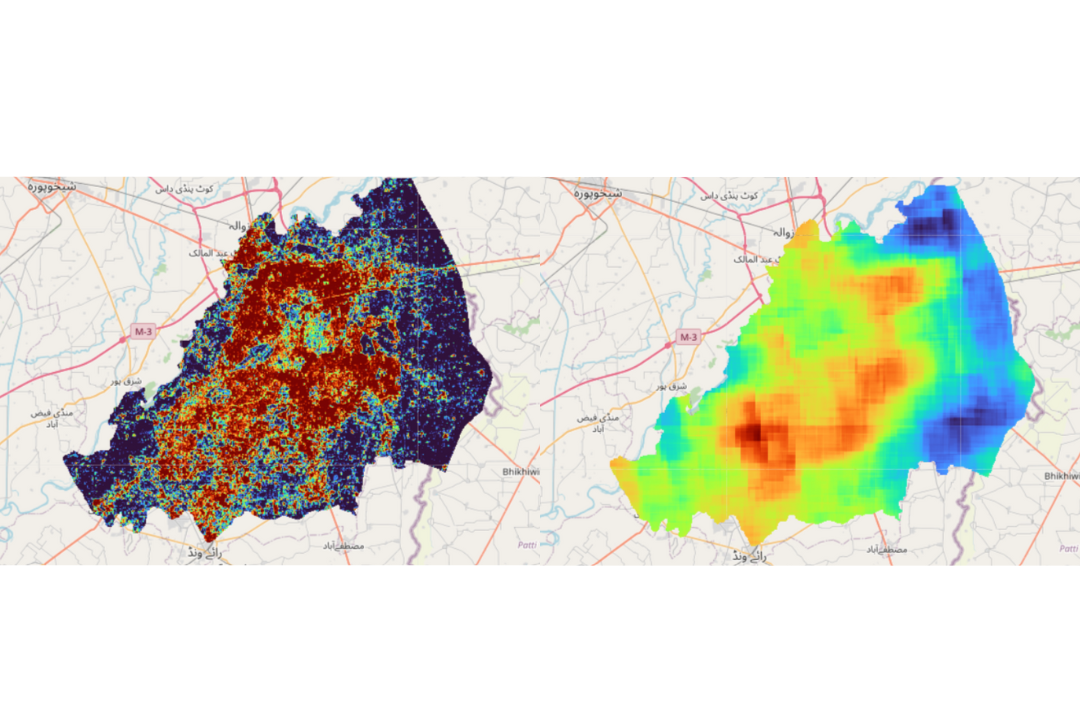
Urban Density and Aerosol Index Analysis
In this project, We assessed urban density and air quality in Lahore, Pakistan in 2024 using Landsat 8 Collection 2 Tier 1 Level 2 data (LANDSAT/LC08/C02/T1_L2) and Sentinel-5P products (COPERNICUS/S5P/OFFL/L3_CO, NRTI/L3_NO2, NRTI/L3_HCHO, NRTI/L3_SO2, OFFL/L3_CH4, NRTI/L3_O3, NRTI/L3_AER_AI). Landsat composite is used to compute spectral indices (NDBI and NBR2) and derive built-up and urban density. These are compared with the 2020 urban density and Aerosol Index to monitor changes.
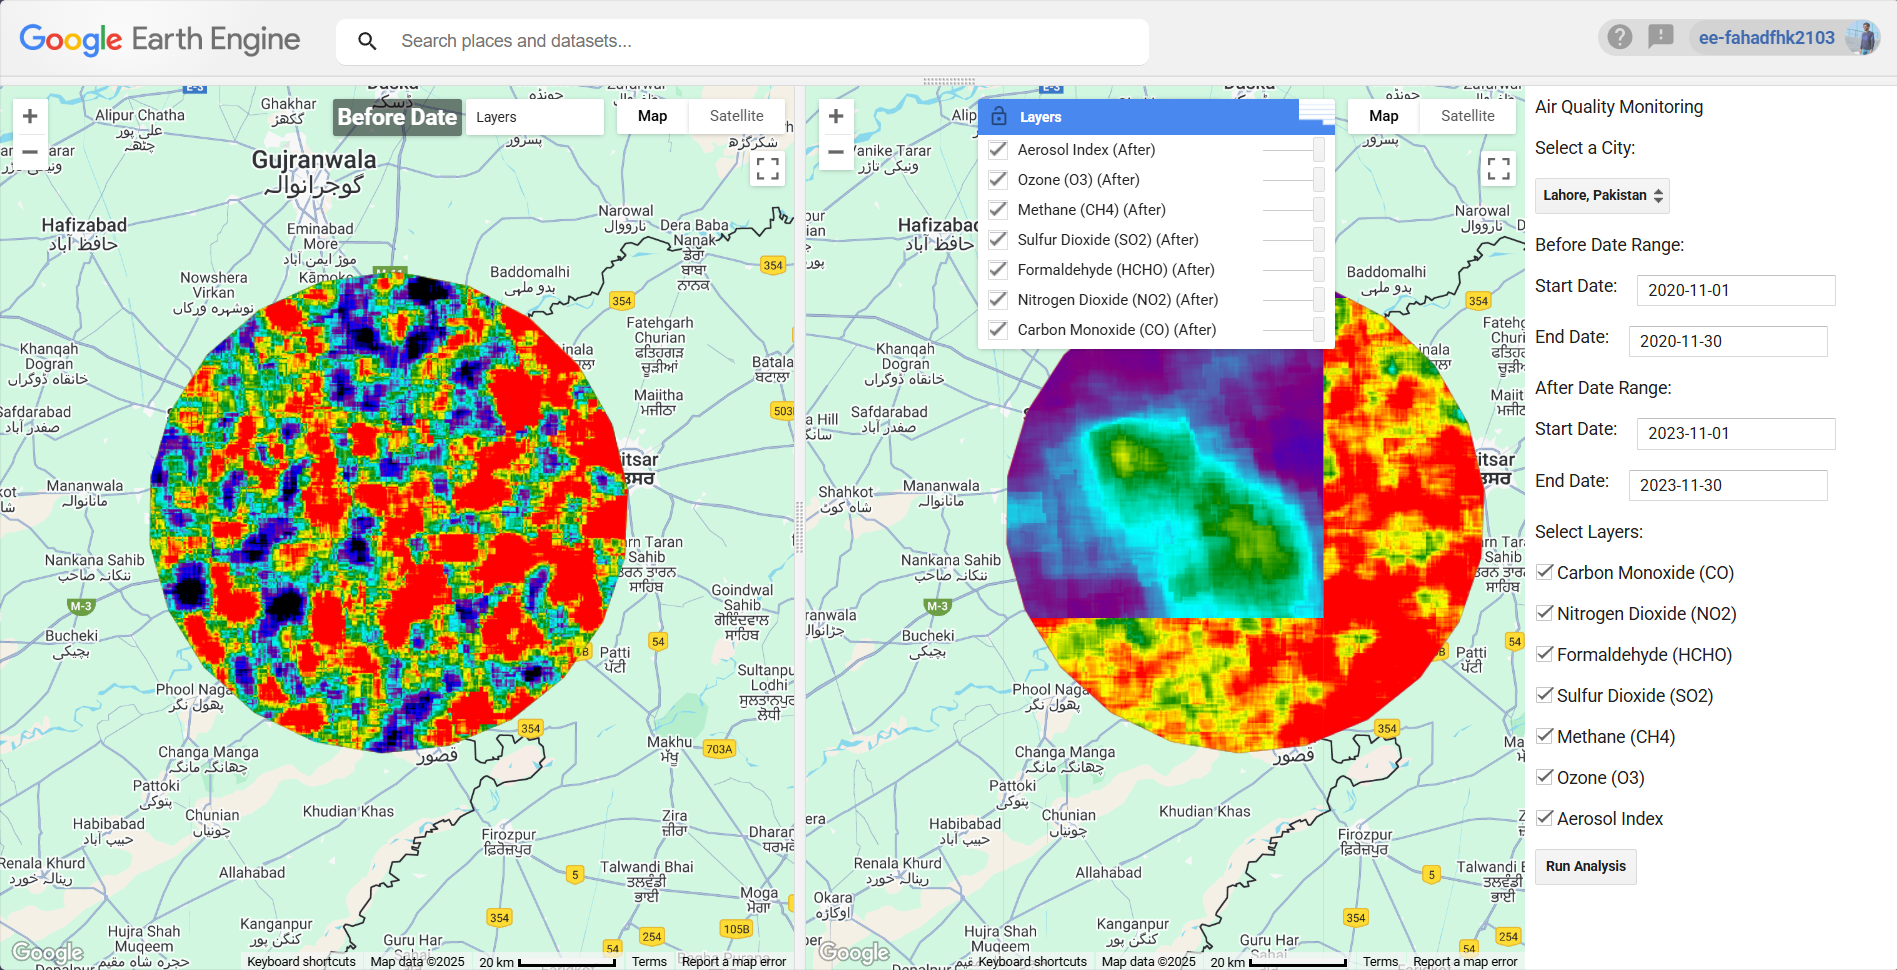
Comparative Urban Air Quality Analysis Tool
This interactive Earth Engine application enables users to monitor and compare air quality across major cities by visualizing pollutant concentrations over two distinct time periods. Users can select a city, set custom date ranges, and toggle multiple atmospheric layers to observe changes in air composition, facilitating detailed before-and-after analyses.
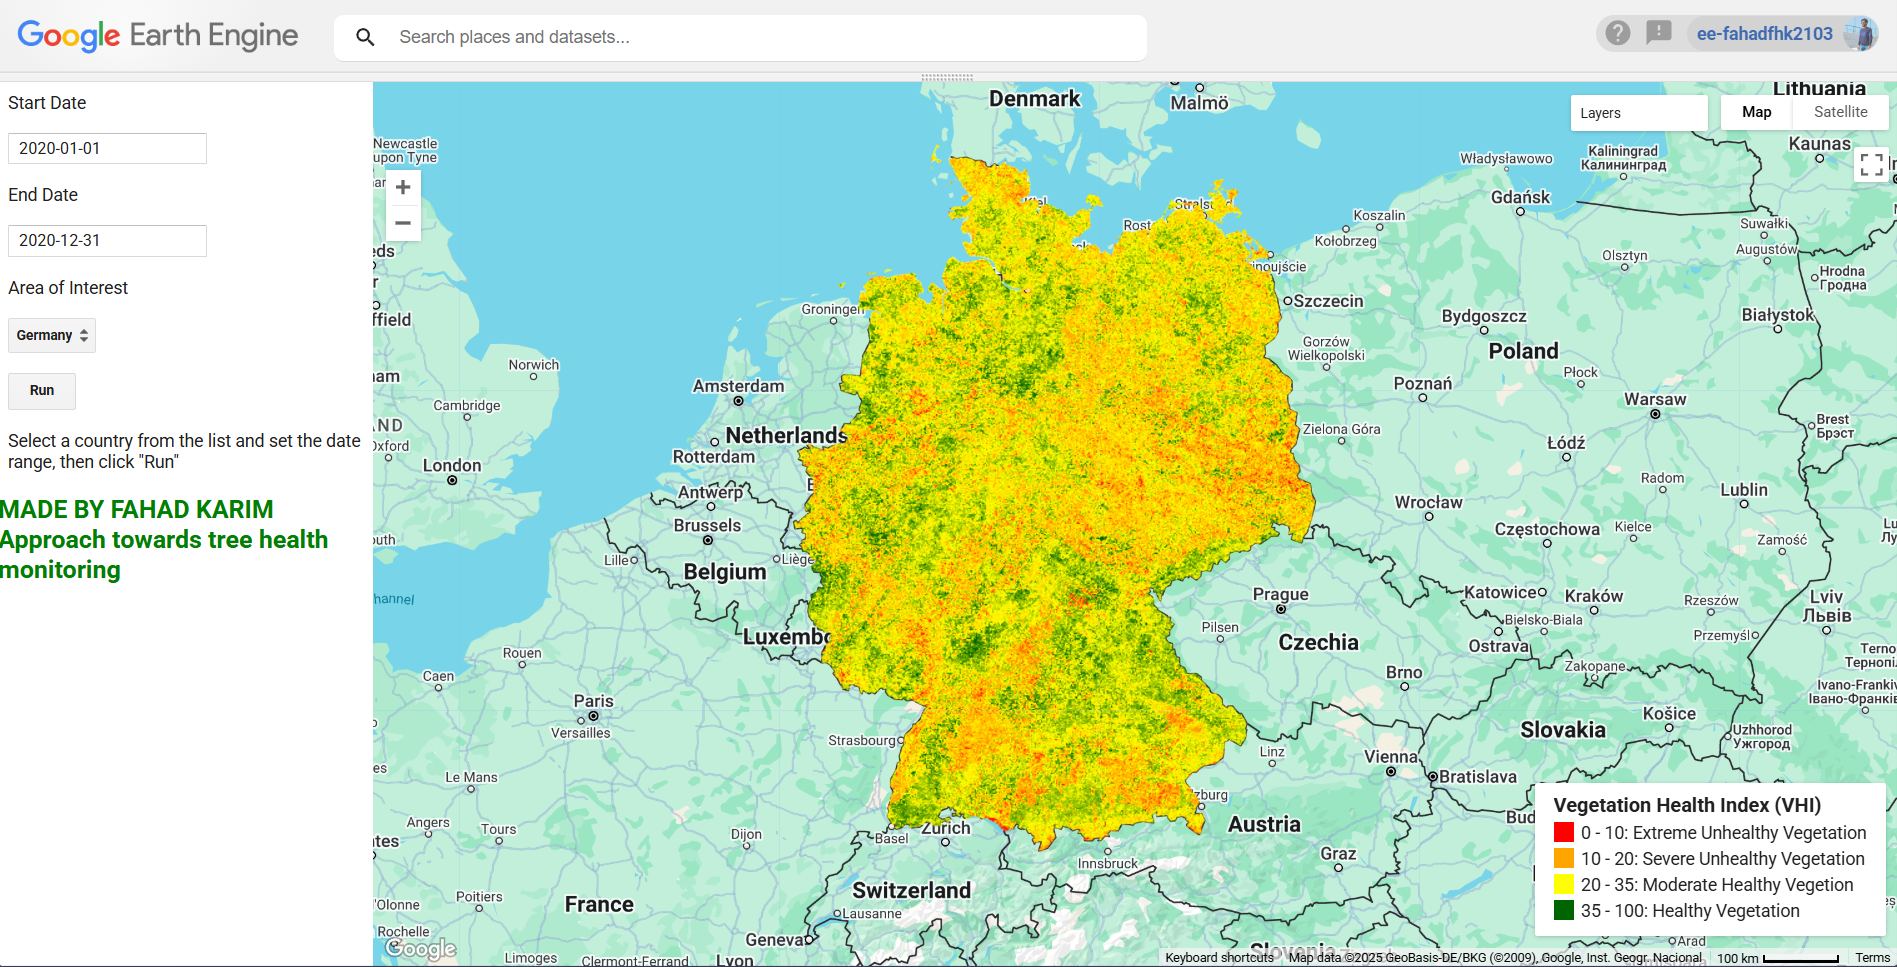
Vegetation Health Index (VHI) Monitoring Tool
This interactive Earth Engine tool computes the Vegetation Health Index (VHI) by analyzing MODIS NDVI and LST data over user-defined date ranges and geographic areas. Users can select a country as the area of interest and visualize vegetation health through a color-coded map, providing insights into tree and ecosystem vitality.
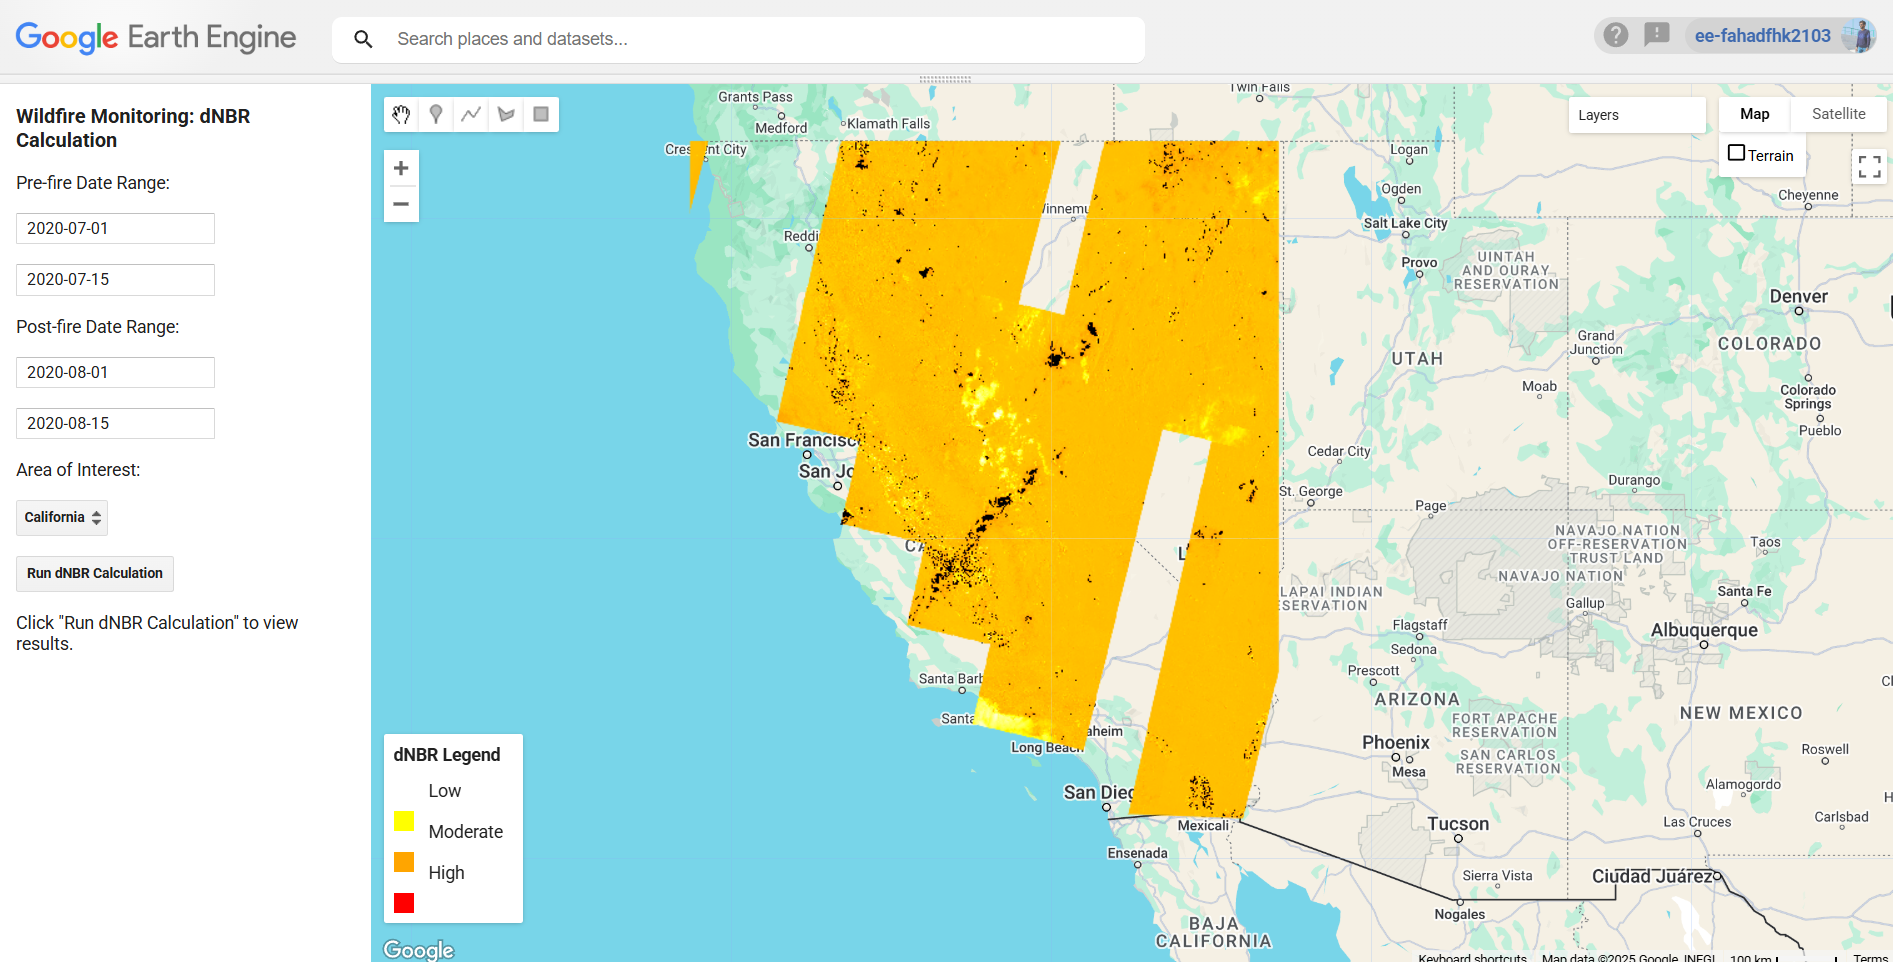
Wildfire Impact Assessment via dNBR Calculation
This interactive Earth Engine application quantifies wildfire impacts by calculating the difference in Normalized Burn Ratio (dNBR) between pre-fire and post-fire periods using Landsat 8 data. Users can select custom date ranges and areas of interest to generate composite images that highlight burned regions. The app visualizes the extent of fire damage and computes an approximate burned area, offering valuable insights for wildfire management and environmental monitoring.
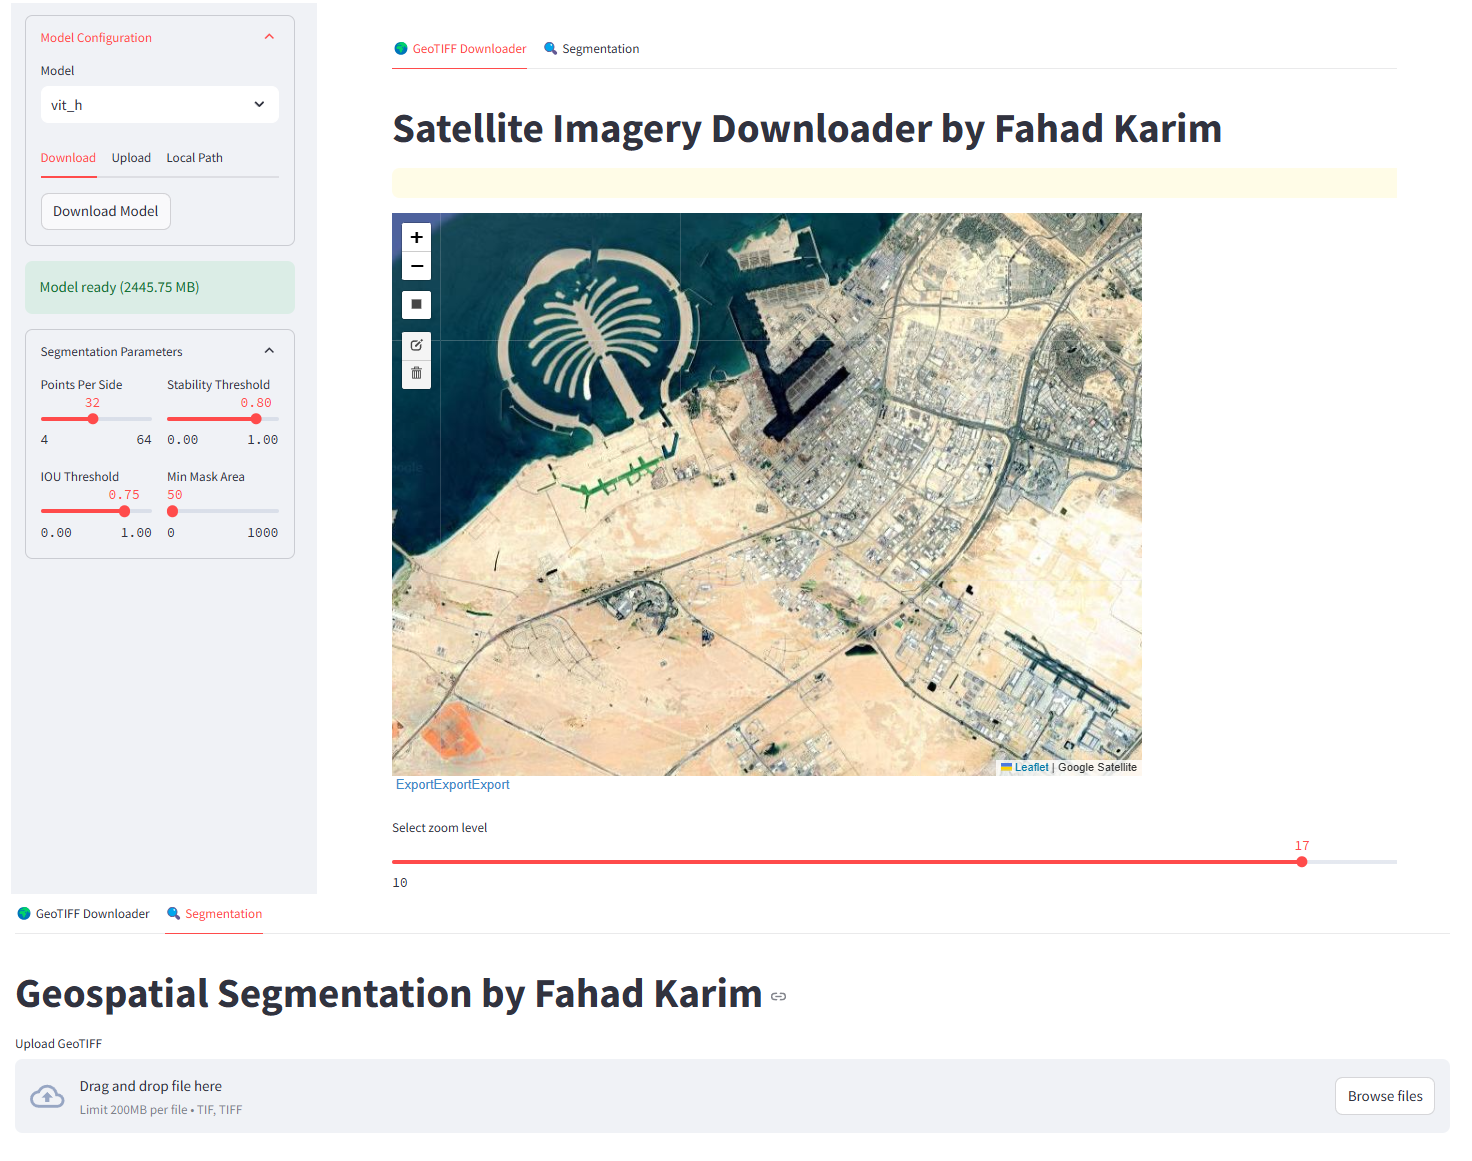
AI Image Segmentation and GeoTIFF Downloader App
This application enables users to retrieve high-resolution GeoTIFF imagery from Google Satellite basemaps and perform semantic segmentation via the Segment-Geospatial Python library. It automates the extraction of geospatial features, generating vectorized GeoJSON outputs for downstream analysis. The tool integrates raster data acquisition, Deep Learning-based segmentation, and vector data export into a streamlined workflow. This solution optimizes geospatial analysis workflows by bridging satellite imagery acquisition and feature extraction.
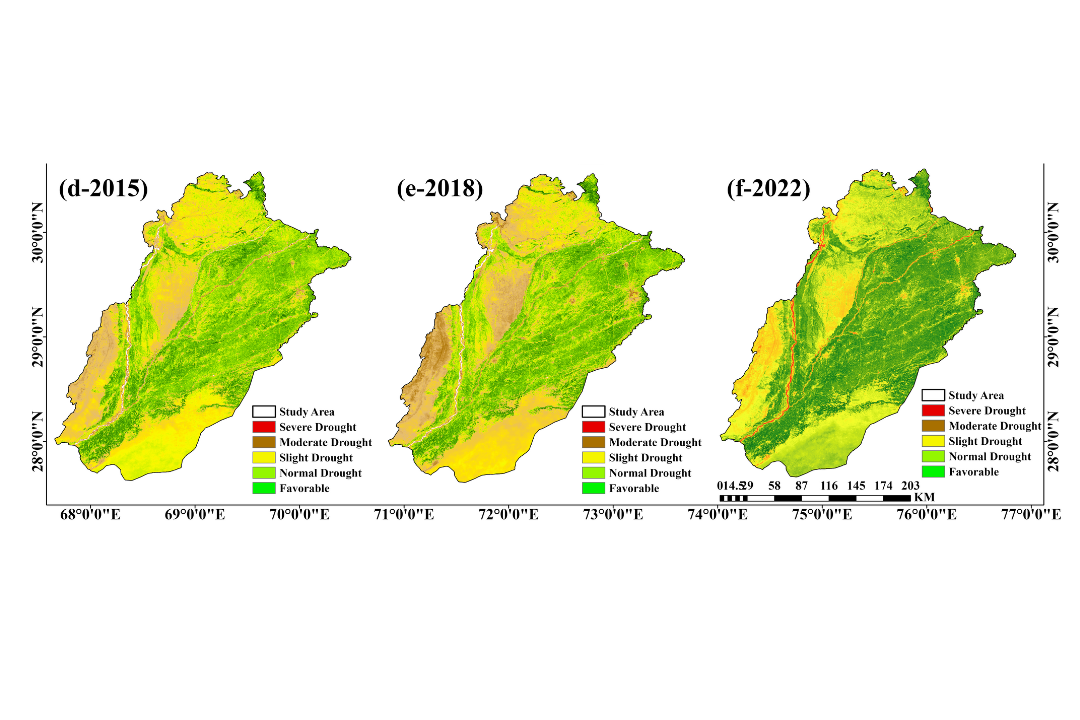
Punjab Drought Analysis 2000-2022
In this project, We developed a Composite Drought Index for Punjab, Pakistan (2001–2022) by integrating calculated Soil Moisture Condition Index (SMCI), the Temperature Vegetation Dryness Index (TVDI), and the Standardized Precipitation Evapotranspiration Index (SPEI). Drought conditions were assessed using MODIS remote sensing data from MOD13Q1 (MODIS/Terra Vegetation Indices 08-Day L3 Global 250m) for NDVI and MOD11A1 (MODIS/Terra Land Surface Temperature/Emissivity Daily L3 Global 1km) for LST, with 2022 drought maps prominently displayed.
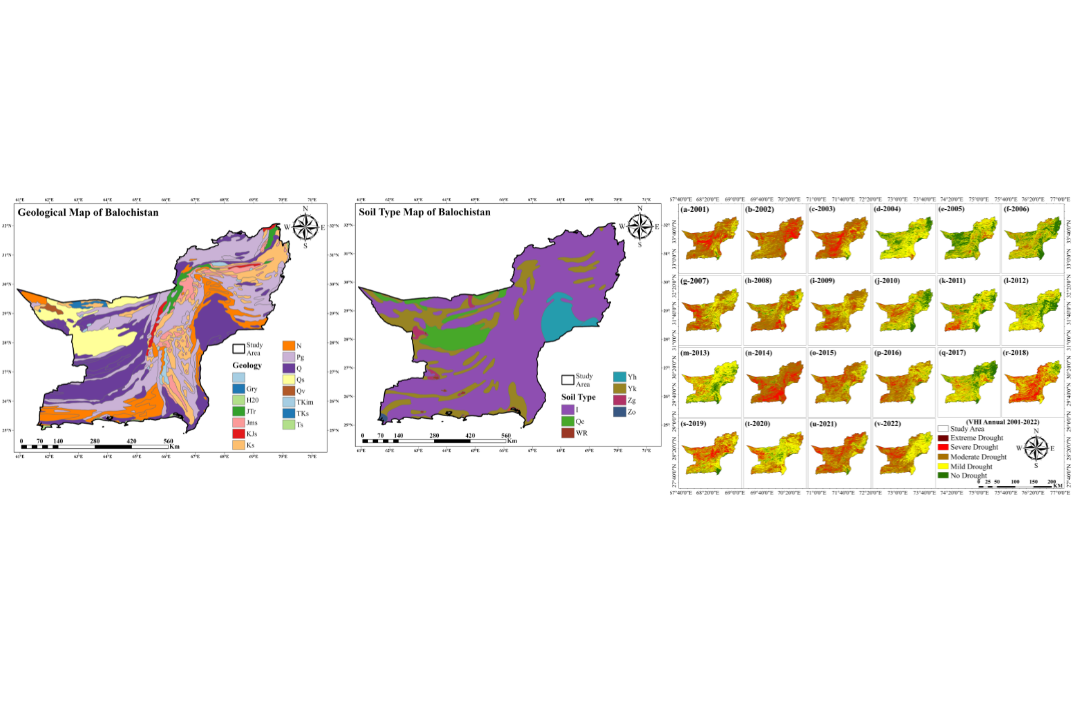
Balochistan Drought Analysis (2001-2022)
In this project, I conducted drought analysis for Balochistan, Pakistan (2001–2022) by calculating key indices Precipitation Condition Index (PCI), Vegetation Health Index (VHI), Standradized Precipitation Evapotranspiration Index (SPEI), and Water Use Efficiency (WUE) using MODIS data. The Project employed MOD13Q1 (MODIS/Terra Vegetation Indices 08-Day L3 Global 250m) for NDVI and MOD11A1 (MODIS/Terra Land Surface Temperature/Emissivity Daily L3 Global 1km) for LST, with 2001-2022 drought maps prominently displayed.
Ready to Start Your Project?
Let's discuss how we can bring the same level of expertise and innovation to your next GIS or Remote Sensing project.